Answered

How to gather charts from different Intercom reports into a single visual dashboard ?

  • 18 August 2022
  • 2 replies
  • 104 views

I need to create a dashboard that gathers certain charts from different reports in intercom and I'm wondering how I should do it and what's the best way to do it.

I need to display the engagement summary of different custom bots + the number of tagged conversations for a specific tag + opening rate of certain emails + reply rate of certain emails + number of new inbound conversations VS number of replied conversations

icon

Best answer by Racheal 23 August 2022, 04:18

View original

2 replies

Userlevel 4
Badge +5

Hey @nicolas h11​ Racheal from the Support Engineer team here 👋🏼


Have you looked into our Custom Reports? With Custom Reports you can create a dashboard with all of your important data and get an overall view with multiple charts. This is an example dashboard I've put together:

Screen Shot 2022-08-22 at 9.08.41 PM
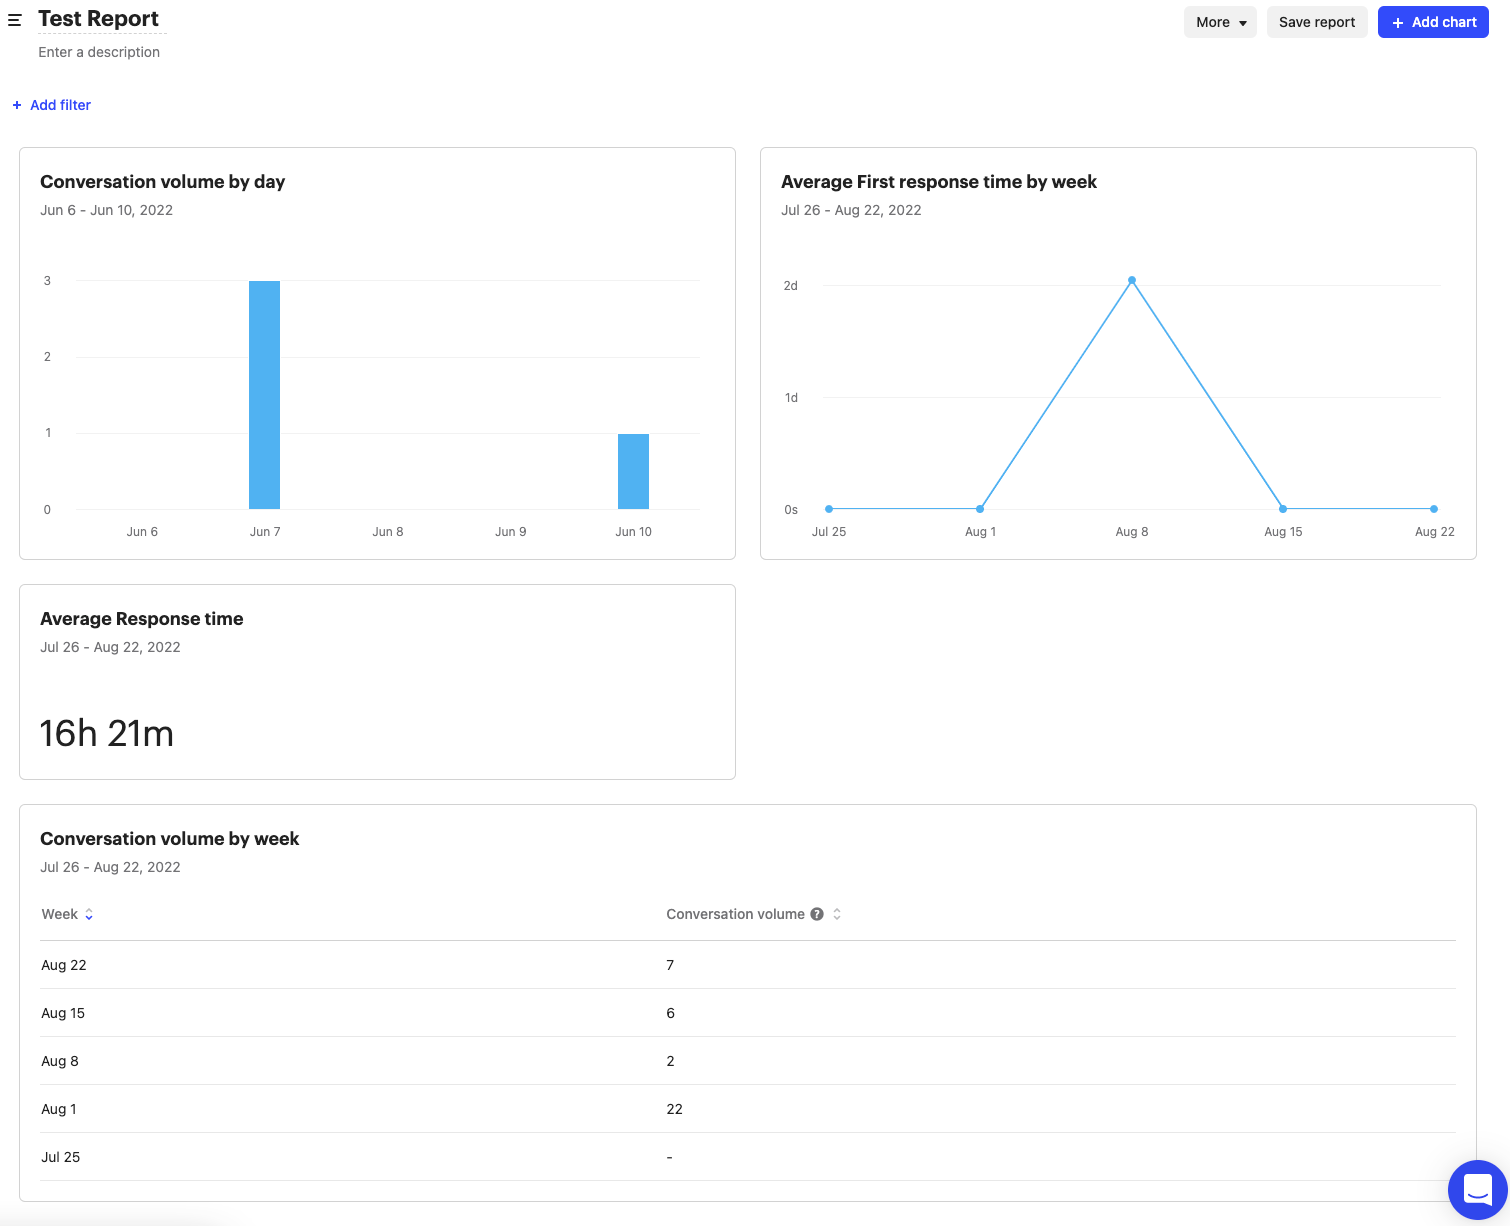
With Custom Reports you could cover the tagged conversations, inbound conversations, and replied conversations. As for email statistics (open and reply rate) this would live in our email deliverability report and Custom Bot data would live in your Custom Bot report. Definitely understand you're trying to roll these into one report- you could use our API to build your own dashboard, but Custom Bot data is not yet available via the API. This is a great request for our @Product Wishlist​ !


To pull your message statistics you'll want to use the export job model and for all other conversation data, the conversation model.


I'll attach an Article on our Custom Reports here:

https://www.intercom.com/help/en/articles/4549035-create-a-custom-report/p>

Hey @racheal​ 👋


Thanks for your answer !

Alright that's what I thought for the custom bot data, just wanted to be sure I wasn't missing something 🙂

Reply